Last Updated on December 6, 2022
You might be aware that the invention of writing started with pictures. In the early centuries, humans used pictures to convey information. Pictographs (pictures) were drawn into the clay with a pointed tool by these people to display information. Therefore, picture graphs have been based on the same principles that people have been using for centuries.
Thank you for reading this post, don't forget to subscribe!
Teaching math picture graphs to kids is important as it helps them to understand basic maths concepts. Continue reading to learn about picture graphs for kindergarten children and how to teach the same to them with the help of activities.
What Is Picture Graph?
Teaching picture graphs to kids? Here is how you can explain it to your children.
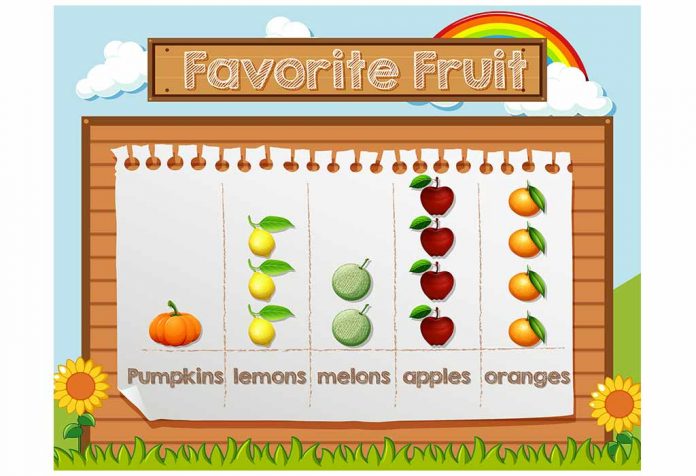
Also known as a pictogram, a picture graph is the pictorial representation of data using pictures, icons, or symbols. We can use picture graphs to represent the frequency of data while using symbols or pictures that are relevant. Picture graphs are one of the simplest ways of representing data.
Let us learn how picture graphs are created with the help of an example.
Here we will prepare the data for the number of TV sets sold in the last few years with the help of a picture graph. Let’s get started.
- First, we will collect the data of the category we want to represent. After that, we will make a list or table using this data and finally review this data before proceeding ahead.
- Next, we will pick a symbol or picture that accurately represents our data. If we are drawing a picture graph to represent TV sets sold, then a symbol of a ball would be highly confusing! So, pick your symbol or an image carefully.
- If the frequency of your data is too high and one symbol of the image cannot represent one frequency, then give a numerical value to one symbol that it will represent. Remember to write this numerical value along with the picture graph. For example, one image of a TV represents 100 TV sets. This is the key to the picture graphs.
- Here is the next step, where you have to draw the picture graph. You first need to draw two columns that represent the category and the data. Then you have to draw the actual symbols that represent the frequencies.
- Finally, review your picture graph and make sure it correctly represents the information that you wanted to display. Make sure to check the labelling of your graph.
Continue reading to learn about the benefits of making picture graphs.
Benefits Of Picture Graph
Picture graphs are widely used in maths. Below are some benefits of teaching picture graphs to children.
- They help children to associate objects with numbers.
- They help children in visually formatting statistics.
- They make information interesting and easy to understand for children.
- They are simple to use and can handle a large amount of data.
- They are unique and is an entertaining ways to present data.
Activity That Will Help Your Preschooler To Learn Picture Graph
Games and activities are one of the most important ways in which children learn. With the help of activities, we can underpin formal learning later in childhood and also enables the child to develop their self-worth. Here is an interesting activity to teach your little one learns to understand picture graphs.
1. Leaf Picture Graph
Material You Need
- Colourful chalks
- Leaves of different shapes, sizes and colours
Using chalk on the floor, make two lines. On one side, write the leaf’s colour name; on the other, write the digits 1, 2, 3, 4, 5, 6, and more if required. Now give your child the leaves and ask them to sort them colour-wise, count leaves of each colour and place them in front of the correct number and colour.
Question To Ask To Preschooler
You can ask your child the following questions related to this activity.
- How many yellow, red, green, brown, purple, etc., leaves are there?
- Are there more green or yellow leaves?
- Which colour leaves are the highest in the count? Which colour has the least number of leaves?
- Can this picture graph tell you something about the trees/leaves this time of year? If yes, what?
- Can you think of another way to sort the leaves and place them in a picture graph?
What Your Preschooler Will Get From Picture Graph Activity
This is a great activity for children to learn about picture graphs, as they can hold and move the leaves and objects around them. This picture graph activity involves everything from sorting and categorising the leaves based on their characteristics to placing them in an order based on their value. Children will learn important maths concepts, like different ways of sorting, colour recognition, counting, and comparing heights and values, with the help of this activity.
Fun Facts About Picture Graph For Preschooler
Here are some fun facts about pictograms or picture graphs for children.
- Picture graphs are also known as pictographs or pictograms.
- The picture graphs were discovered in 3000 BC in Egypt and Mesopotamia.
- The word picture originates from “pict” which is a Latin word meaning painted, and the word graph is related to the word “diagram” in English.
Hope we have cleared all your doubts related to the picture graphs. If you have any more questions, do drop them in the comment box below, and we will reply in no time.
Also Read:
Clothes Names for Preschoolers in English
How to Introduce 2D Shapes to Preschoolers
Numerical Expression for Kindergarten Children


